

Hoe werkt Visitor Insight ?
Welkom! Wij vertellen u graag wat meer over de mogelijkheden van Visitor Insight Amsterdam.
Visitor Insight kent verschillende autorisatieniveaus. Dat betekent dat verschillende partijen verschillende rechten hebben om bij cijfers of bij de invoermogelijkheid van cijfers te komen. We maken het volgende onderscheid:
- Allen
- Partners van amsterdam&partners
- Instellingen/medewerkers die data aanleveren
1. Allen
Visitor Insight is een online data dashboard voor iedereen die op de hoogte wil blijven van de bezoekerseconomie van Amsterdam. De basisinformatie vind je op de volgende pagina's:
Dashboard pagina
Dashboard startpagina geeft een overzicht van het bezoek aan Amsterdam vs de overige gebieden die zijn aangesloten bij Visitor Insight.
Actueel
Deze pagina geeft een algemeen overzicht van de stand van zaken van het bezoek aan Amsterdam. Dit is opgebouwd uit een aantal belangrijke databronnen: het aantal hotelovernachtingen vanuit CBS, de inkomende buitenlandse passagiers op Schiphol vanuit Royal Schiphol Group, en het aantal bezoeken in de belangrijkste musea/attracties en theaters van Amsterdam periodiek aangeleverd door de instellingen zelf.
Deze pagina geeft een algemeen overzicht van de stand van zaken van het bezoek aan Amsterdam. Dit is opgebouwd uit een aantal belangrijke databronnen: het aantal hotelovernachtingen vanuit CBS, de inkomende buitenlandse passagiers op Schiphol vanuit Royal Schiphol Group, en het aantal bezoeken in de belangrijkste musea/attracties en theaters van Amsterdam periodiek aangeleverd door de instellingen zelf.
Hotelovernachtingen / Hotelgasten in stadsgebied alleen
In stadsgebied alleen betekent binnen de stad Amsterdam. Deze hotelstatistieken hebben betrekking op de ruim 500 hotels in Amsterdam, verzameld en bewerkt door het CBS. Deze data wordt standaard met 2-3 maanden na de betreffende periode opgeleverd.
Schiphol
De inkomende buitenlandse passagiers op Schiphol vanuit Royal Schiphol Group zijn hier vermeld.
Over Visitor Insight
Hier vindt u achtergrondinformatie over het systeem en een korte uitleg over de verschillende mogelijkheden.
Hier vindt u achtergrondinformatie over het systeem en een korte uitleg over de verschillende mogelijkheden.
Nieuws
Betreft nieuws aangaande Visitor Insight zelf, zoals nieuwe indicatoren en functionaliteiten.
Betreft nieuws aangaande Visitor Insight zelf, zoals nieuwe indicatoren en functionaliteiten.
2. Partners van amsterdam&partners
Partners van amsterdam&partners kunnen met een aangevraagde gratis login de data meer in detail bekijken.
Als partner heeft u een gebruikersnaam nodig waarmee u een wachtwoord kunt creëren. Dit kunt u aanvragen via partner@iamsterdam.com. Ook kunt u hier terecht met vragen of indien u de codes kwijt bent.
Als u inlogt krijgt u toegang tot de volgende pagina’s en modules:
Musea*
Ruim 30 musea leveren periodiek bezoekaantallen aan voor deze module. De resultaten worden zowel grafisch als in tabelvorm weergegeven. Het gewenste jaar kan geselecteerd worden en de bijbehorende bezoekaantallen op maandtotaalniveau komen in beeld. Alle individuele maandcijfers zijn alleen beschikbaar voor de musea zelf. Tevens kunnen op basis van een aantal filters extra analyses worden gemaakt
Theaters*
Circa 10 theaters leveren periodiek bezoekaantallen aan voor deeze module. De resultaten worden zowel grafisch als in tabelvorm weergegeven. Het gewenste jaar kan geselecteerd worden en de bijbehorende bezoekaantallen op maandtotaalniveau komen in beeld. Alle individuele maandcijfers zijn alleen beschikbaar voor de theaters zelf. Tevens kunnen op basis van een aantal filters extra analyses worden gemaakt
Attracties*
Circa 10 attracties leveren periodiek bezoekaantallen aan voor deze module. Onder resultaten vindt u de bezoekaantallen per maand van de eigen attractie en de totale bezoekaantallen per maand van alle attracties.Het gewenste jaar kan geselecteerd worden en de bijbehorende bezoekaantallen op maandtotaalniveau komen in beeld. De individuele maandcijfers van de overige attracties zijn niet beschikbaar. Tevens kunnen op basis van een aantal filters extra analyses worden gemaakt
Schiphol aankomsten
De inkomende buitenlandse passagiers worden verkregen via de website van Royal Schiphol Group. De resultaten worden zowel grafisch als in tabelvorm weergegeven. Het gewenste jaar kan geselecteerd worden en de bijbehorende bezoekaantallen op maandtotaalniveau komen in beeld.
Hotelovernachtingen / Hotelgasten in stadsgebied alleen
De data met betrekking tot hotelovernachtingen en hotelgasten in de ruim 500 hotels in Amsterdam, wordt verkregen via het CBS. Deze data wordt standaard met 2-3 maanden na de betreffende periode opgeleverd. De resultaten worden zowel grafisch als in tabelvorm weergegeven. Het gewenste jaar kan geselecteerd worden en de bijbehorende aantallen overnachtingen en/of gasten op maandtotaalniveau komen in beeld. Tevens kunnen op basis van een aantal filters extra analyses worden gemaakt.
Zeecruise Amsterdam:
Het totaal aantal maandelijkse passagiers aan boord van schepen wordt periodiek aangeleverd door de Passenger Terminal. Dit totaal bestaat uit zowel Transit passagiers (Amsterdam wordt aangedaan tijdens de reis/route die gevaren wordt) en Turnaround passagiers (nieuwe passagiers die in Amsterdam aan boord gaan en hun reis beginnen). De resultaten worden zowel grafisch als in tabelvorm weergegeven. Het gewenste jaar kan geselecteerd worden en de bijbehorende aantallen overnachtingen en/of gasten op maandtotaalniveau komen in beeld.
International (non-) Corporate meetings
Hotels, Universiteiten, Venues en Congrescentra leveren periodiek data aan met betrekking tot deelname aan (non-) corporate meetings. De resultaten worden zowel grafisch als in tabelvorm weergegeven. Het gewenste jaar kan geselecteerd worden en de bijbehorende aantallen overnachtingen en/of gasten op maandtotaalniveau komen in beeld.
VVV Vestigingen - I amsterdam Store
De data met betrekking tot het aantal maandelijkse bezoekers aan de I amsterdam Store wordt periodiek aangeleverd door amsterdam&partners. De resultaten worden zowel grafisch als in tabelvorm weergegeven. Het gewenste jaar kan geselecteerd worden en de bijbehorende aantallen overnachtingen en/of gasten op maandtotaalniveau komen in beeld.
City Cards
De data met betrekking tot het totaal aantal maandelijks geactiveerde I amsterdam City Cards wordt periodiek aangeleverd door amsterdam&partners. Het is niet mogelijk om cijfers per kaartsoort te zien. De resultaten worden zowel grafisch als in tabelvorm weergegeven. Het gewenste jaar kan geselecteerd worden en de bijbehorende aantallen overnachtingen en/of gasten op maandtotaalniveau komen in beeld.
Website bezoeken
De data met betrekking tot het aantal unieke bezoekers per maand op de website www.iamsterdam.com wordt periodiek aangeleverd door amsterdam&partners. De resultaten worden zowel grafisch als in tabelvorm weergegeven. Het gewenste jaar kan geselecteerd worden en de bijbehorende aantallen overnachtingen en/of gasten op maandtotaalniveau komen in beeld.
Voor de bovenstaande pagina's geldt ook de mogelijkheid om de module Vergelijkingen te openen. Hier is het mogelijk om vergelijkingen te maken tussen:
-
Bezoekaantallen van alle musea of de top 10 musea in verschillende perioden:maanden/jaren;
-
Bezoekaantallen van alle attracties in verschillende perioden: verschillende maanden/jaren;
- Bezoekaantallen van alle theaters in verschillende perioden: verschillende maanden/jaren;
-
Overnachtingscijfers van de verschillende hotelcategorieën, verschillende maanden/jaren;
-
Inkomende buitenlandse passagiers op Schiphol uit verschillende jaren/maanden;
-
Bezoekaantallen van de I amsterdam Store in verschillende perioden: verschillende maanden/jaren;
-
Aantal geactiveerde I amsterdam City Cards in verschillende perioden: verschillende maanden/jaren;
-
Aantallen unieke bezoekers www.iamsterdam.com in verschillende perioden: verschillende maanden/jaren.
Tevens is het mogelijk om vergelijkingen tussen de verschillende modules te maken indien hiervoor data beschikbaar is, dus bijvoorbeeld de top 10 musea tegenover het totale aantal hotelgasten. Maar ook tussen verschillende accounts, bijvoorbeeld tussen Amsterdam en Stockholm (indien beide accounts voor dezelfde modules gegevens hebben ingevoerd).
Rapporten en publicaties
amsterdam&partners is bezig om deze pagina te actualiseren. Releante rapportage en publicaties zullen in de loop van dit jaar beschikbaar komen.
Invoermodule
Niet voor partners
Uitloggen
Wanneer u uitlogt komt u weer op de dashboard pagina terecht.
* De bezoekcijfers van de Amsterdamse musea, attracties en theaters zijn gebaseerd op bezoek-aantallen die de ruim 36 musea, 13 attracties en 10 theaters zelf invoeren in Visitor Insight. Het aantal bezoeken in de belangrijkste musea/attracties en theaters van Amsterdam wordt periodiek aangeleverd door de instellingen zelf, deze worden met een maand na afsluiten van de betreffende periode opgeleverd. amsterdam&partners verwerkt de data, echter is erbij afhankelijk van het aanlevermoment van de onderliggende bronnen/partners. Dit betekent dat wij niet kunnen waarborgen dat alle data altijd actueel en volledig is.
3. Musea, attracties, theaters en VVV Vestigingen
Om de bezoekersaantallen voor de museum-, attractie- en theatermonitor in te kunnen voeren is het noodzakelijk om u aan te melden. Klik hiervoor aan de linkerkant op: inloggen.
Er verschijnt een scherm waarin de gebruikersnaam en password ingevoerd kunnen worden. Deze gegevens heeft u eerder via de e-mail ontvangen.
Na het inloggen verschijnen aan de linkerkant in beeld extra modules die geraadpleegd kunnen worden. Eén van deze modules is de invoermodule. Wanneer u hierop klikt om bezoekerscijfers in te voeren. verschijnt het volgende scherm:
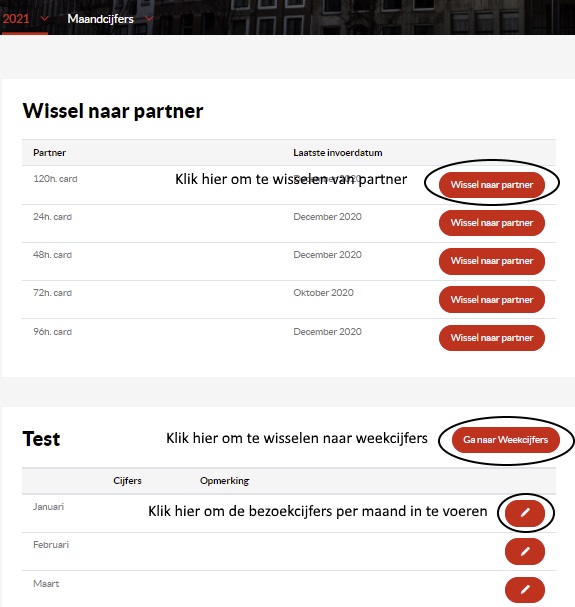
Bovenin staat de naam van bijvoorbeeld uw museum, attractie of theater (hier is dat 120h ccard, 24h card etc). Indien u verantwoordelijk bent voor 1 instelling staat er hier slechts 1 naam. U kunt wisselen tussen diverse 'instellingen'.
De maanden waarvan de vakjes wit zijn, zijn de maanden waar de bezoekersaantallen ingevoerd kunnen worden. Klik op de rode knop met het pen en papiertje. Dan opent zich een nieuw scherm.

Vul het bezoekaantal in en het tekstvak onder de balk kunnen specifieke opmerkingen worden ingevoerd, denk hierbij aan gewijzigde openingstijden of speciale tentoonstellingen. Klik vervolgens op opslaan.
Nadat de bezoekersaantallen zijn opgeslagen, zijn deze nog niet zichtbaar in het resultatenscherm van de musea, attracties en/of theaters. Aan het eind van de maand, nadat alle musea, attracties en theaters hun cijfers hebben ingevoerd, worden deze vrijgegeven door amsterdam&partners. Vanaf dat moment zijn ze zichtbaar in het resultatenscherm. Tot die tijd is het alleen mogelijk om de eigen bezoekersaantallen in de invoermodule te bekijken.
In de eerste week van elke maand ontvangt u een reminder via de e-mail met daarin de link naar Visitor Insight, om de bezoekersaantallen in te voeren. Vervolgens krijgt u drie weken de tijd om deze aantallen in te voeren. Gedurende deze drie weken kunt u de ingevoerde gegevens nog wijzigen. Na deze drie weken wordt de maand afgesloten en kunnen de gegevens niet meer worden gewijzigd. Natuurlijk is amsterdam&partners altijd in staat om eventuele wijzigingen of correcties aan te brengen indien noodzakelijk. Deze kunnen dan doorgegeven worden via research@iamsterdam.com.
Daarnaast hebben de musea, theaters en de VVV Vestigingen dezelfde toegangsmogelijkheden als de leden van amsterdam&partners (zie boven a t/m h), met daarbij nog inzicht in individuele cijfers per deelnemer. Voor attracties geldt alleen inzicht in de eigen individuele bezoekerscijfers.